Connecting Revenue and Profitability: Flow Through and Flex Explained
Hoteliers track numerous metrics to understand the health of their properties in both the short and long term. Top-line revenue metrics are foundational to understanding hotel performance—but they’re only the beginning. When those metrics shift, the question isn’t just what changed, but how those changes ultimately impact profitability.
Two metrics help answer that question: Flow Through and Flex.
Together, they show how efficiently a hotel converts revenue growth into profit (Flow Through) and how well profits are protected when revenue declines (Flex).
What is Flow Through?
Flow Through measures how effectively incremental revenue is retained as profit after operating costs.
Flow Through % = (Change in GOP ÷ Change in Total Revenue) * 100
A high Flow Through indicates that a hotel is converting revenue growth into profit efficiently. In practical terms, a larger share of each incremental revenue dollar reaches the bottom line, rather than being absorbed by labor, utilities, or other operating costs. This suggests a hotel is scaling its operation without eroding profit margins—reflecting disciplined cost control, operational leverage, and a strong mix of demand. In these cases, performance isn’t driven simply by selling more rooms, but by selling more profitable rooms.
A negative Flow Through indicates that gross operating profit (GOP) declined despite revenue growth.
| Scenario | >100% | 100% | <100% |
| Positive (+) Flow Through | GOP increased more than a dollar for each additional dollar of revenue earned. | GOP increased a dollar for each additional dollar of revenue earned. | GOP increased by less than a dollar for each additional dollar of revenue earned. |
| Negative (-) Flow Through | GOP decreased more than a dollar for each additional dollar of revenue earned. | GOP decreased a dollar for each additional dollar of revenue earned. | GOP decreased by less than a dollar for each additional dollar of revenue earned. |
What is Flex?
Flex represents a hotel’s ability to manage expenses and protect profit margins when revenue decreases. It measures how much of the lost revenue does not translate into a corresponding decline in profit.
Flex % = (1 − (Change in GOP ÷ Change in Total Revenue)) × 100
When revenue falls, a high Flex indicates that the operation can scale down effectively, with costs adjusting as demand and pricing power soften. Hotels with high Flex are better positioned to withstand short‑term market pressures, demonstrating an operating structure that supports not only growth during strong periods, but stability during slower ones.
| Negative Flex (<0%) | 0% Flex | 0–100% Flex | 100% Flex | >100% Flex |
| GOP decreased more than revenue, indicating no cost mitigation and incremental losses beyond the top line. | GOP decreased in line with revenue, with no cost savings achieved. | GOP decreased less than revenue, reflecting partial cost mitigation and preserved GOP. | GOP holds steady, as all lost revenue was fully offset by cost savings. | GOP increased despite the revenue decline, as cost savings exceed the lost revenue. |
Examples of Flow Through and Flex
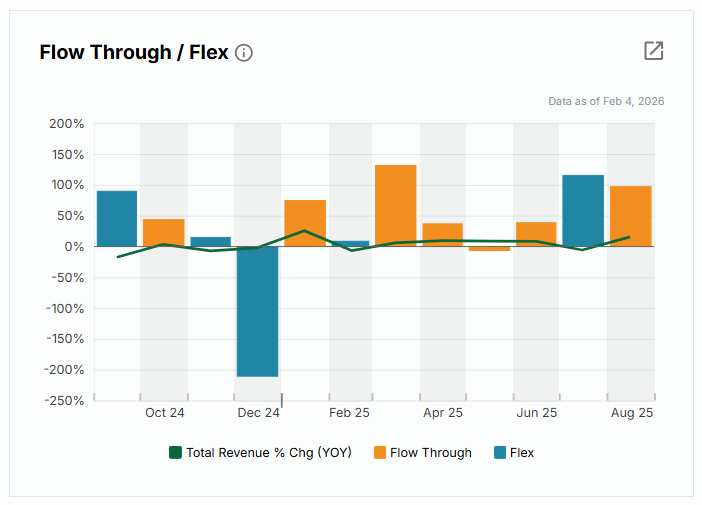
From the above chart within the STR Benchmark section of CoStar:
December 2024
- Revenue decreased 2%, with Flex of –211%. In addition to the revenue decline, the hotel incurred an additional $1.11 loss in GOP for every $1 of lost revenue.
- Interpretation: Revenue pressure was compounded by rising costs, leading to a disproportionate decline in GOP and significant margin deterioration.
May 2025
- Revenue increased 9%, but Flow Through was negative (7%). For every incremental dollar of revenue earned, GOP declined by approximately $0.07.‑6.5%). For every incremental dollar of revenue earned, GOP declined by approximately $0.07.
- Interpretation: While top-line growth was achieved, expenses grew faster than revenue, resulting in margin erosion and a net decline in profitability.
July 2025
- Revenue declined 6%, while Flex reached 115%. The hotel fully offset the revenue decline through cost savings and generated an additional $0.15 increase in GOP for every $1 of lost revenue.
- Interpretation: Cost controls more than compensated for the top‑line decline, resulting in improved profitability despite lower revenue.
August 2025
- Revenue increased 16%, with 97% Flow Through. Nearly every incremental revenue dollar converted to profit, with $0.97 flowing through to GOP for each $1 of additional revenue.
- Interpretation: Revenue growth was highly efficient, indicating strong operating leverage and minimal incremental cost associated with the increase.
When to Use Flow Through and Flex
The examples above compare the current reporting period to a comparable prior period, focusing on changes in GOP. While this year-over-year view is common, Flow Through and Flex are versatile metrics with multiple practical applications.
Beyond comparing total revenue and GOP year over year, these metrics can be used to:
- Evaluate performance at the department level
- Analyze results across different timeframes
- Assess how operational decisions impact profitability as conditions change
Used this way, Flow Through and Flex help explain not just what changed—but why profitability moved the way it did. Viewed alongside market and Comp Set benchmarks, Flow Through and Flex reveal whether profitability changes are property‑specific or market‑driven.
Conclusion
Understanding what drives Flow Through and Flex elevates the conversation beyond simple statements like “revenue was up” or “we had a tough comp.” Instead, it shifts the focus to a more fundamental question: Did your strategy strengthen the business?
On their own, Flow Through and Flex are just numbers. But when viewed in context—benchmarked against market peers—they become powerful indicators of operational efficiency, cost discipline, and financial resilience.
Using CoStar with STR Benchmark, hoteliers can place their performance in that context and make smarter, more confident decisions to maximize profitability in any market condition.
More than 90,000 hotels worldwide already benchmark their performance through CoStar.
Get started: Add P&L Participation
New to benchmarking? Discover the only platform that integrates revenue, expenses, profit, and property lifecycle insights.
Request a Demo
Discover how CoStar could help your business.
Contact us at 888-226-7404 or submit this form to request a demo.