
Connecting Revenue and Profitability: Flow Through and Flex Explained
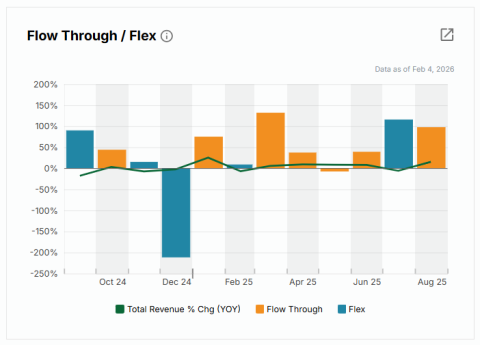
Hoteliers track numerous metrics to understand the health of their properties in both the short and long term. Top-line revenue metrics are foundational to understanding hotel performance—but they’re only the beginning. When those metrics shift, the question isn’t just what changed, but how those changes ultimately impact profitability.
Two metrics help answer that question: Flow Through and Flex.
Filters
Global Hotel Market Forecast Assumptions – Q3 2026
Global Hotel Market Forecast Assumptions – Q3 2026STR and Tourism Economics currently produce forecasts for 59 markets across Europe, the Middle East and Asia Pacific regions. The analysis below summarizes the latest forecast revisions.
Europe short-term outlook:
U.S. Hotel Forecast Assumptions – Q3 2026
U.S. Hotel Forecast Assumptions – Q3 2026Strong demand observed in Q1 continued through Q2 2026. That demand, coupled with continued pricing power that was further lifted by impressive World Cup premiums, has led STR and Tourism Economics to raise year-end RevPAR growth projections to +4.4%. Both demand and ADR have been upgraded as well, to +1.7% and +3.1%, respectively.
The pace of RevPAR growth will slow next year as the industry rebalances following a mild downturn in 2025 and recovery-driven 2026. RevPAR is forecasted to increase 2.1%, with the gain coming from a mix of 1.1% demand growth and ADR increasing 1.6%.
Beyond GDP and Inflation: Several alternative indicators show strong predictive value for U.S. hotel demand
Beyond GDP and Inflation: Several alternative indicators show strong predictive value for U.S. hotel demandTraditional indicators such as GDP, inflation, wage growth, and unemployment have long guided hotel demand forecasts. However, uneven economic conditions across income groups and traveler segments are weakening their effectiveness. Alternative inputs tied more directly to household finances and behavior may now provide stronger predictive value.
U.S. Hotel Forecast Assumptions – Q2 2026
U.S. Hotel Forecast Assumptions – Q2 2026The first four-plus months of 2026 beat projections, prompting CoStar and Tourism Economics to significantly upgrade the 2026 U.S. RevPAR growth forecast to +2.8%. Year to date through April, U.S. RevPAR growth came in at 4.0%. Additionally, Q1 RevPAR was the highest on record.
Global Hotel Market Forecast Assumptions – Q2 2026
Global Hotel Market Forecast Assumptions – Q2 2026Global Hotel Market Forecast Assumptions – February 2026
Global Hotel Market Forecast Assumptions – February 2026STR and Tourism Economics currently produce forecasts for 59 markets across Europe, the Middle East, Africa and Asia Pacific region. The analysis below summarizes the latest forecast revisions.
Connecting Revenue and Profitability: Flow Through and Flex Explained
Connecting Revenue and Profitability: Flow Through and Flex Explained
Hoteliers track numerous metrics to understand the health of their properties in both the short and long term. Top-line revenue metrics are foundational to understanding hotel performance—but they’re only the beginning. When those metrics shift, the question isn’t just what changed, but how those changes ultimately impact profitability.
Two metrics help answer that question: Flow Through and Flex.
U.S. Hotel Forecast Assumptions – February 2026
U.S. Hotel Forecast Assumptions – February 2026The first STR/Tourism Economics forecast of 2026 projects full-year RevPAR growth of 0.6%, a 10‑basis‑point upward revision from the November 2025 revision.
Game-changing metrics: How Super Bowl LX will shape San Francisco’s hotel market
Game-changing metrics: How Super Bowl LX will shape San Francisco’s hotel marketAnalysis by Nick Seaman
It’s that time of year again – two NFL powerhouses will battle for the Super Bowl LX title, with this year’s showdown happening 8 February at Levi’s Stadium in the San Francisco Bay Area.
Is hotel compression back in Australia?
Is hotel compression back in Australia?Analysis by Hannah Smith
This year has been strong for Australia, which has outpaced many regions in hotel performance growth. More noteworthy is the way in which Australia has achieved that growth.