
Fall school breaks the week of the Columbus Day holiday contributed to the highest U.S. hotel occupancy level since early August, as hotel demand increased in 70% of U.S. markets.
In the week ending Oct. 9, 22% of students in the U.S. were out on fall break, according to the School Break Report by STR, CoStar’s hospitality analytics firm.
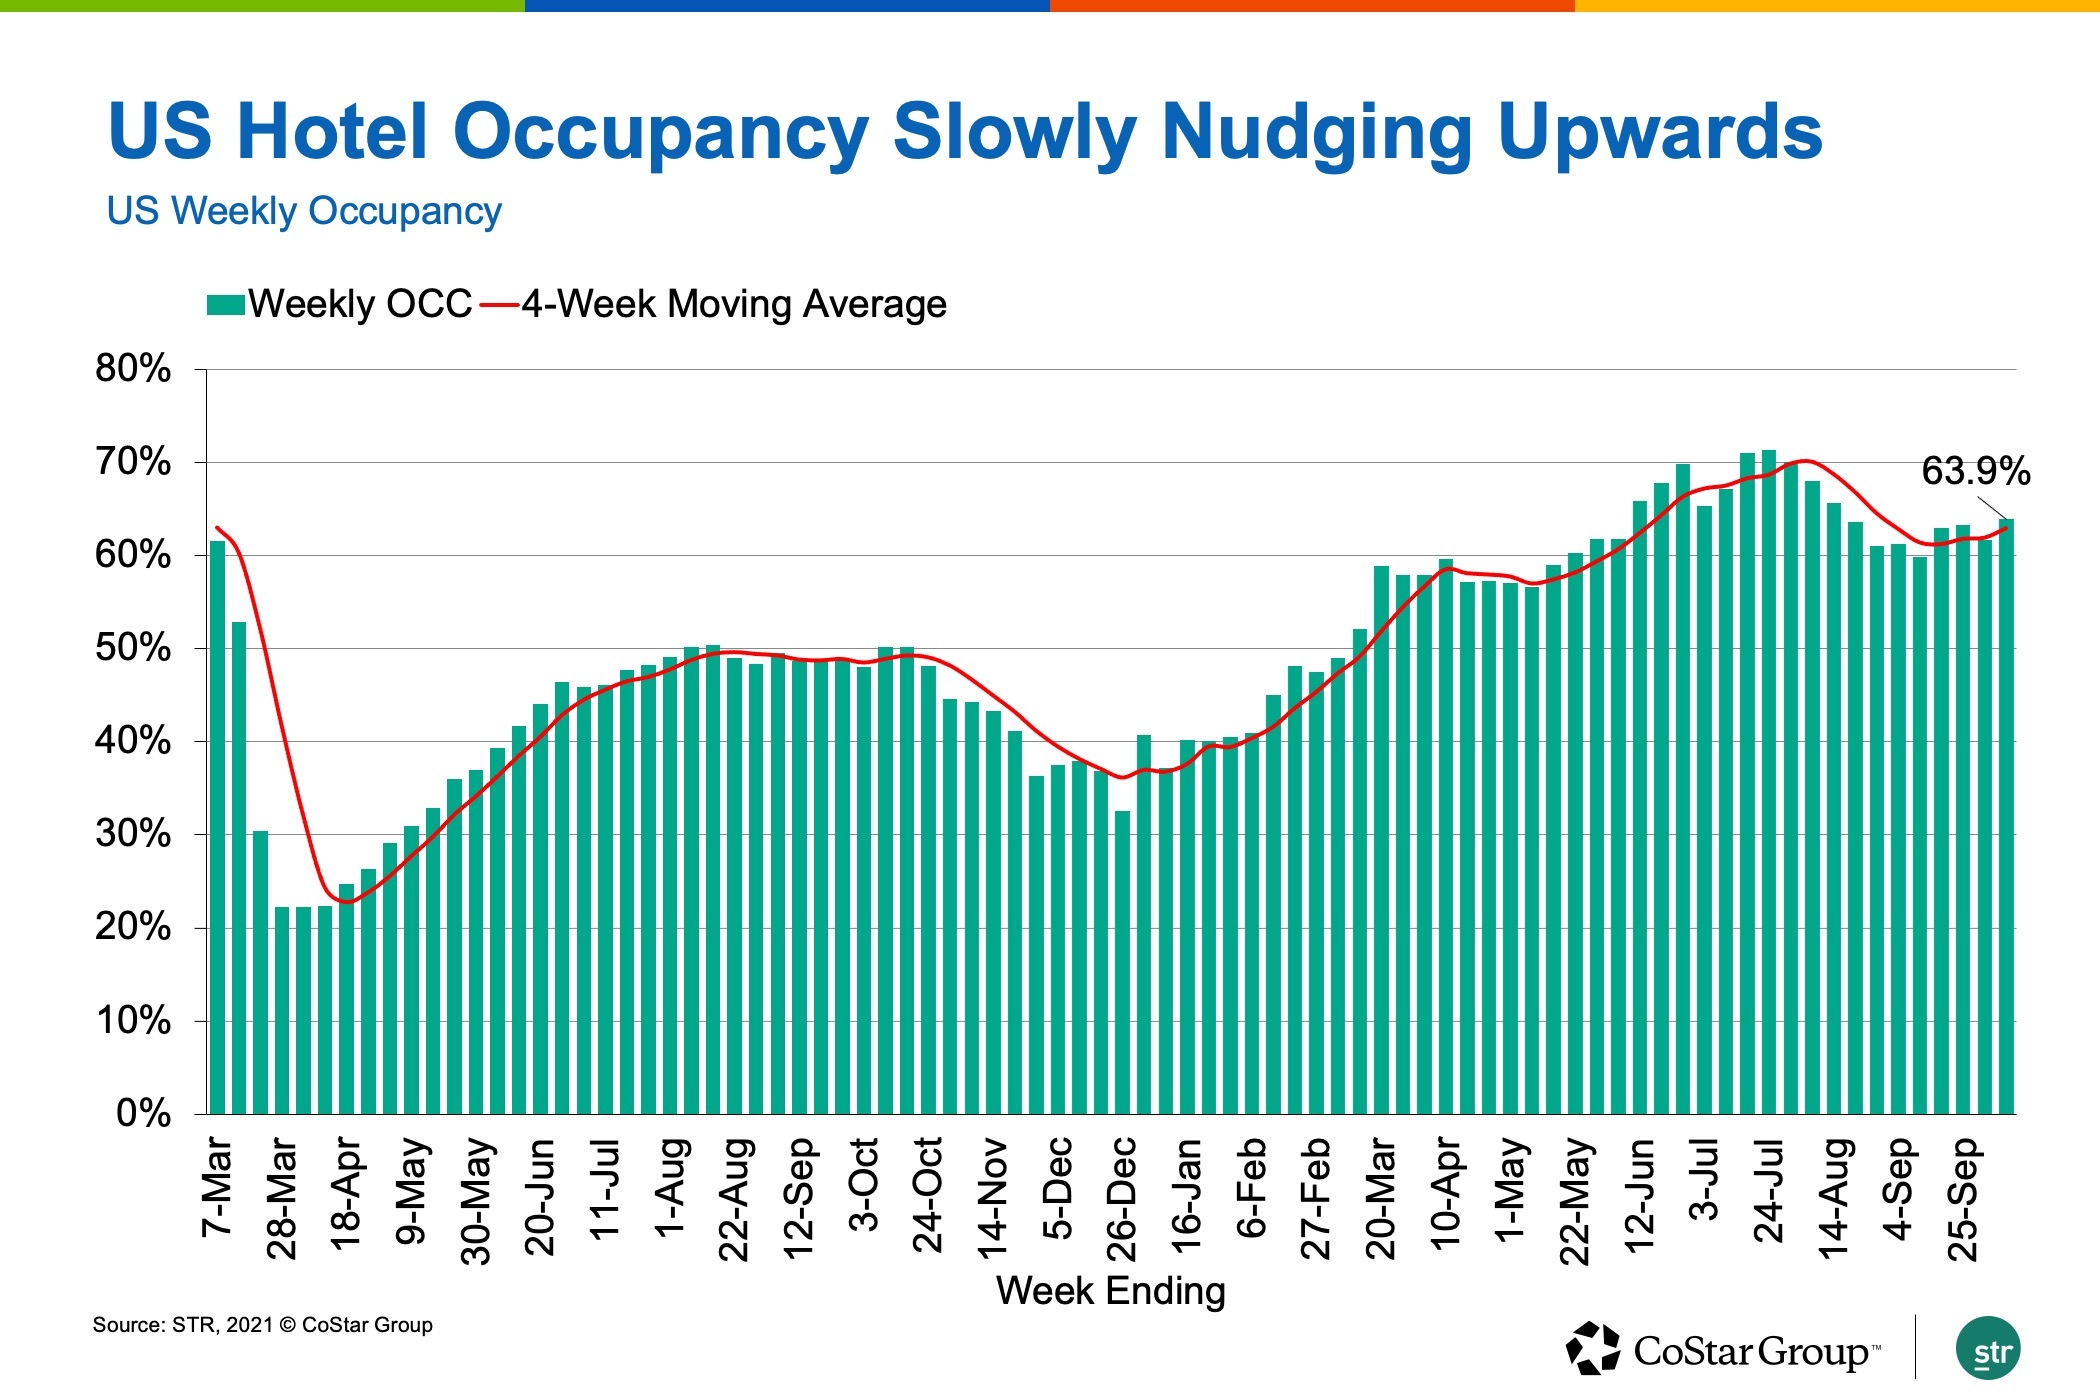
U.S. hotel occupancy for the week was 63.9%, up 2.2 percentage points from the previous week.
At the property level, more than 64% of all hotels reported occupancy higher than 60% for the week, the most of the past eight weeks. Forty-five percent of hotels had occupancy above 70%, and one quarter were above 80% during the week.

With 47,000 rooms still temporarily closed, total-room-inventory weekly occupancy was a bit less at 61.6%.
Room demand, the number of room nights sold, was 92% of what it was during the same week in 2019. That index to 2019 is slightly lower than it was the previous week, down 0.3 points, which is surprising as the week in 2019 included the Jewish observation of Yom Kippur, which should have presented an easier comparison.
Over the past 28 days, room demand was 91% of 2019 levels and has been above 90% for the past 17 weeks on a moving 28-day basis. On a hotel level, 40% of reporting hotels had higher demand this past week than they did in the same week of 2019. Over the past 28 days, demand surpassed 2019 levels in 39% of all reporting hotels.
Markets in resort and leisure destinations reported the largest demand gains, especially during the extended holiday weekend, led by Orlando where hotel occupancy was up 9.3 percentage points from the previous week.
The top 25 largest U.S. hotel markets also experienced demand growth, which is an indicator of business travel recovery. Chicago, Los Angeles and New York City led the top 25 in hotel demand gains for the week.
New York City sold more than 521,000 hotel room nights a week after that number fell below 500,000. More than 2,400 temporarily closed hotel rooms in the city reopened during the week, but that didn’t hold back occupancy, which reached 66% for the week. Occupancy in the market has been above 65% in five of the past six weeks. Weekend occupancy was propelled to a pandemic high of 82% with room demand at its highest since early 2020 in five of the 10 submarkets, including the three largest. New York City hotel occupancy grew throughout the week, except on Sunday, with the growth rate accelerating from midweek to weekend.
This growth pattern was replicated across the entire U.S., with weekend occupancy the highest of the past 10 weeks at 79%. Weekday occupancy rebounded to 58% after falling in the previous week and was comparable to what it was two weeks ago.
Weekly average daily rate grew by its largest amount of the past 13 weeks, up 2.7%, as 63% of markets posted week-over-week growth. Nearly a quarter of markets reported weekly ADR increases of more than 5%. ADR for the week was 2.4% higher than what it was in 2019, as 77% of markets reported higher ADR than they had in the comparable 2019 week. The percentage of markets with higher ADR this year than in 2019 has been above 70% in 14 of the past 15 weeks. Real inflation-adjusted ADR was higher than 2019’s level in 52% of markets for the week. Real ADR has surpassed 2019 levels in more than half of U.S. markets for 12 of the past 15 weeks.
The growth in occupancy and ADR propelled weekly total-room-inventory revenue per available room by 6.1% week over week, the largest gain of the past 13 weeks. TRI RevPAR was 90% of the 2019 level. Overall, 55% of markets had higher TRI RevPAR this week than in the comparable week of 2019.
On a 28-day moving total basis, weekly TRI RevPAR was 87% of the 2019 level. The index has been below 90 for the past three weeks.

However, the percentage of markets that are at “peak” — TRI RevPAR indexed to 2019 above 100 — increased to 51% from 46% a week ago. Markets in “recovery” — TRI RevPAR indexed to 2019 between 80 and 100 — remained unchanged at 36%, but there were less markets (11%) in “recession” — TRI RevPAR Indexed to 2019 between 50 and 80.

Three markets — San Francisco, San Jose and New York City — continued to be in the “depression” category, WITH TRI RevPAR indexed to 2019 below 50. For the week, New York City moved into the “recession” category, but the previous three weeks kept it in the “depression” category on the 28-day basis.
Isaac Collazo is VP Analytics at STR.
This article represents an interpretation of data collected by CoStar's hospitality analytics firm, STR. Please feel free to contact an editor with any questions or concerns. For more analysis of STR data, visit the data insights blog on STR.com.